Meet Lisa. Lisa is a marketing manager at a mid-sized e-commerce company. She spends hours crafting email campaigns, ensuring the subject lines are engaging, the content is valuable, and the call-to-action is compelling. But despite her best efforts, she often finds herself wondering: Are my emails actually working?
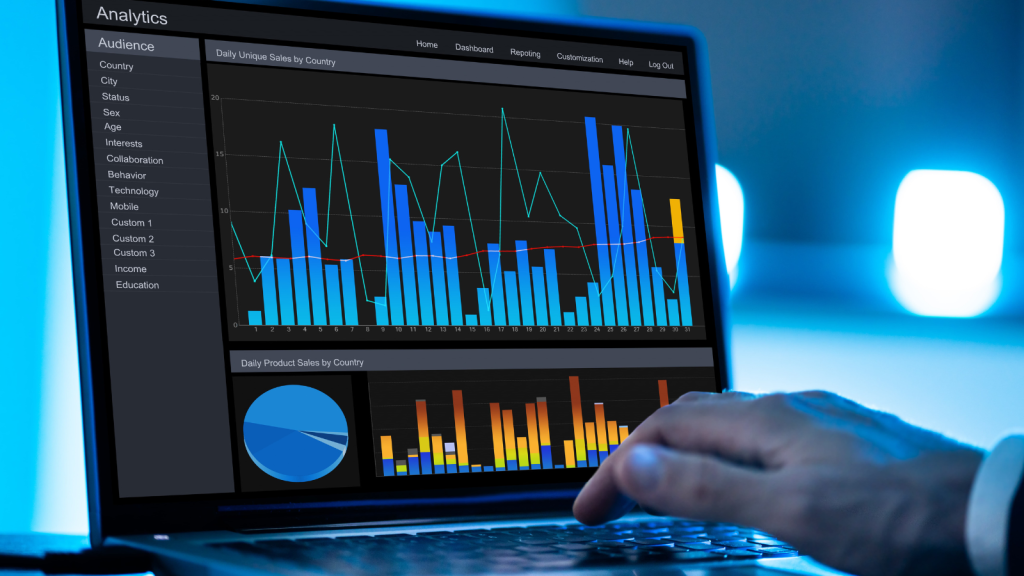
That’s where an email analytics dashboard comes in. It’s like a crystal ball for email marketers, giving insights into what’s working, what’s not, and what could be improved. In this article, we’ll break down exactly how to set up an email analytics dashboard to track performance—while uncovering some untold tips and tricks along the way.
Why You Need an Email Analytics Dashboard
Imagine Lisa sends out an email campaign promoting a flash sale. She sees an initial spike in website visits but has no idea which emails drove the most traffic, what subject lines performed best, or how many people clicked through but didn’t make a purchase. Without an email analytics dashboard, she’s flying blind.
A well-structured dashboard consolidates all these metrics into one place, helping Lisa (and you) make data-driven decisions.
Step 1: Choosing the Right Email Analytics Metrics
Before setting up a dashboard, you need to define which metrics are important to you. Here are the key ones:
- Open Rate – How many people opened your email?
- Click-Through Rate (CTR) – How many clicked on links in the email?
- Conversion Rate – How many completed the desired action (purchase, sign-up, etc.)?
- Bounce Rate – How many emails failed to be delivered?
- Unsubscribe Rate – How many recipients opted out?
Pro Tip: Use NLP (Natural Language Processing) tools to analyze email subject lines. This can reveal what types of language encourage more opens and clicks.
Step 2: Selecting the Right Tools
You don’t need a degree in data science to set up an email analytics dashboard. Several tools can make the process easy, including:
- Google Data Studio – Connects with email platforms and provides customizable dashboards.
- Tableau – Great for visualizing trends over time.
- Power BI – Ideal for companies that want deeper integration with Microsoft products.
- Email Marketing Platforms (Mailchimp, HubSpot, etc.) – These often have built-in analytics.
Untold Trick: Integrate sentiment analysis tools to understand the tone of email responses. If recipients reply with negative sentiment, it might indicate an issue with your email content.
Step 3: Setting Up Your Dashboard
Lisa decides to use Google Data Studio because it integrates seamlessly with her email marketing tool. Here’s how she sets up her dashboard:
- Connect Data Sources – She links her email platform with Google Data Studio.
- Create Visualizations – She sets up graphs to track open rates, click-through rates, and conversions over time.
- Segment the Data – She filters by audience type, campaign type, and device used.
- Automate Reports – She schedules automatic reports to land in her inbox every Monday morning.
Pro Tip: Set up real-time alerts for drastic changes. If your unsubscribe rate suddenly spikes, you’ll want to act fast.
Step 4: Using NLP for Better Insights
Lisa wants to take her dashboard to the next level. She integrates NLP (Natural Language Processing) to analyze customer responses. Here’s what she discovers:
- Subject Line Sentiment Analysis – Emails with positive or curiosity-driven subject lines perform 20% better.
- Response Tone Analysis – Customers using words like “frustrated” or “confused” in replies indicate a potential issue with the offer.
- Content Optimization – NLP tools suggest alternative phrasing for better engagement.
Untold Trick: Use AI-driven tools like GPT-based models to craft subject lines with the highest probability of engagement.
Step 5: Continuously Improve Your Strategy
The beauty of an email analytics dashboard is that it evolves with your marketing strategy. Lisa now checks her dashboard weekly, adjusting subject lines, experimenting with different CTAs, and even optimizing send times.
She notices something fascinating—emails sent at 8 AM on Tuesdays consistently perform 30% better than those sent on Fridays. This discovery allows her to tweak her campaign scheduling for better results.
Final Thoughts
An email analytics dashboard isn’t just a nice-to-have; it’s an essential tool for any marketer who wants to optimize their campaigns. By tracking the right metrics, using NLP to gain deeper insights, and continuously testing and improving, you’ll transform your email marketing strategy from guesswork into a data-driven powerhouse.
Lisa now has confidence in every email she sends, knowing she can measure its impact and refine her approach. And with the right setup, you can do the same!
So, are you ready to take your email marketing to the next level? Start building your dashboard today and unlock the insights you’ve been missing.

